Boston's Safest Driver Competition
Ever wonder if you’re as good a driver as you think you are?
In the spring of 2015, former Mayor Martin J. Walsh announced a commitment to eliminate traffic fatalities and serious injuries from our roadways through a Vision Zero initiative. Much of the initiative’s success rests on the ability of Bostonians to change the way they behave when they are behind the wheel of a car.
Capitalizing on the competitive nature of our City, we piloted the first edition of the Boston’s Safest Driver competition in the fall of 2016 to great outcomes. In 2019, we again partnered with Cambridge Mobile Telematics to bring a safe driving competition to some of the largest vehicle trip generators in the entire city through workplace challenges.
About the app
Boston’s Safest Driver is a smartphone app developed in partnership with:
- the City of Boston's Transportation Department
- the Mayor's Office of New Urban Mechanics, and
- Cambridge Mobile Telematics.
The 2019 competition also received support from Liberty Mutual Insurance and the National Safety Council. The competition was administered by Promosis.
In 2016, the competition received support from Arbella Insurance Foundation.
The app provides feedback to drivers on five metrics for each trip they take:
- rapid acceleration
- harsh braking
- sharp turns
- at-risk speeding, and
- phone distraction.
The app logs trips while in the background on the user’s phone. The driver is alerted afterwards of their score for that trip. They are also told how they did on the different factors and given helpful tips to improve in the future.
Instead of a typical safety campaign that tells people how to behave, we want people to reflect on their own skills, challenge their friends, and be rewarded for doing well.
2019 competition
In 2019, we again partnered with Cambridge Mobile Telematics to bring a safe driving competition to some of the largest vehicle trip generators in the entire city through workplace challenges. In the initial pilot of Boston’s Safest Driver, we saw the greatest growth of use from informal competitions among friends, family, and co-workers. Building upon this finding, we partnered with the City’s Transportation Management Associations (TMAs) to incentivize adoption in both large and mid-size employers.
Overall results
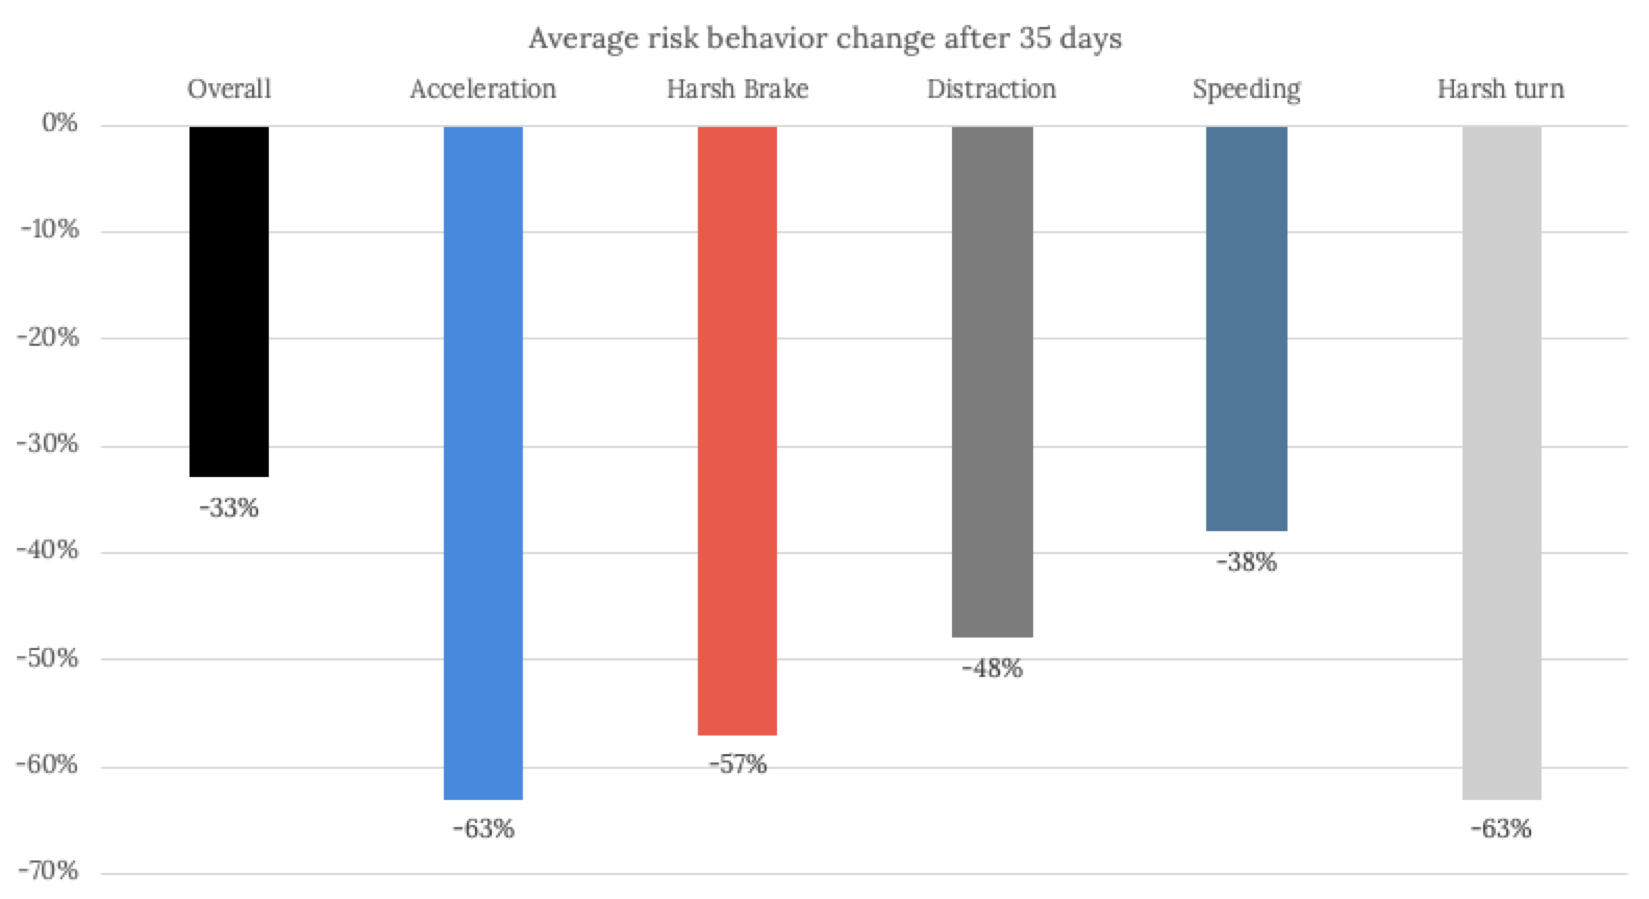
We saw positive results overall. The graph shows the average risk behavior change after 35 days of usage. There were significant reductions in unsafe behaviors in all the categories. These results are in line with our 2016 competition findings.
Trip breakdown
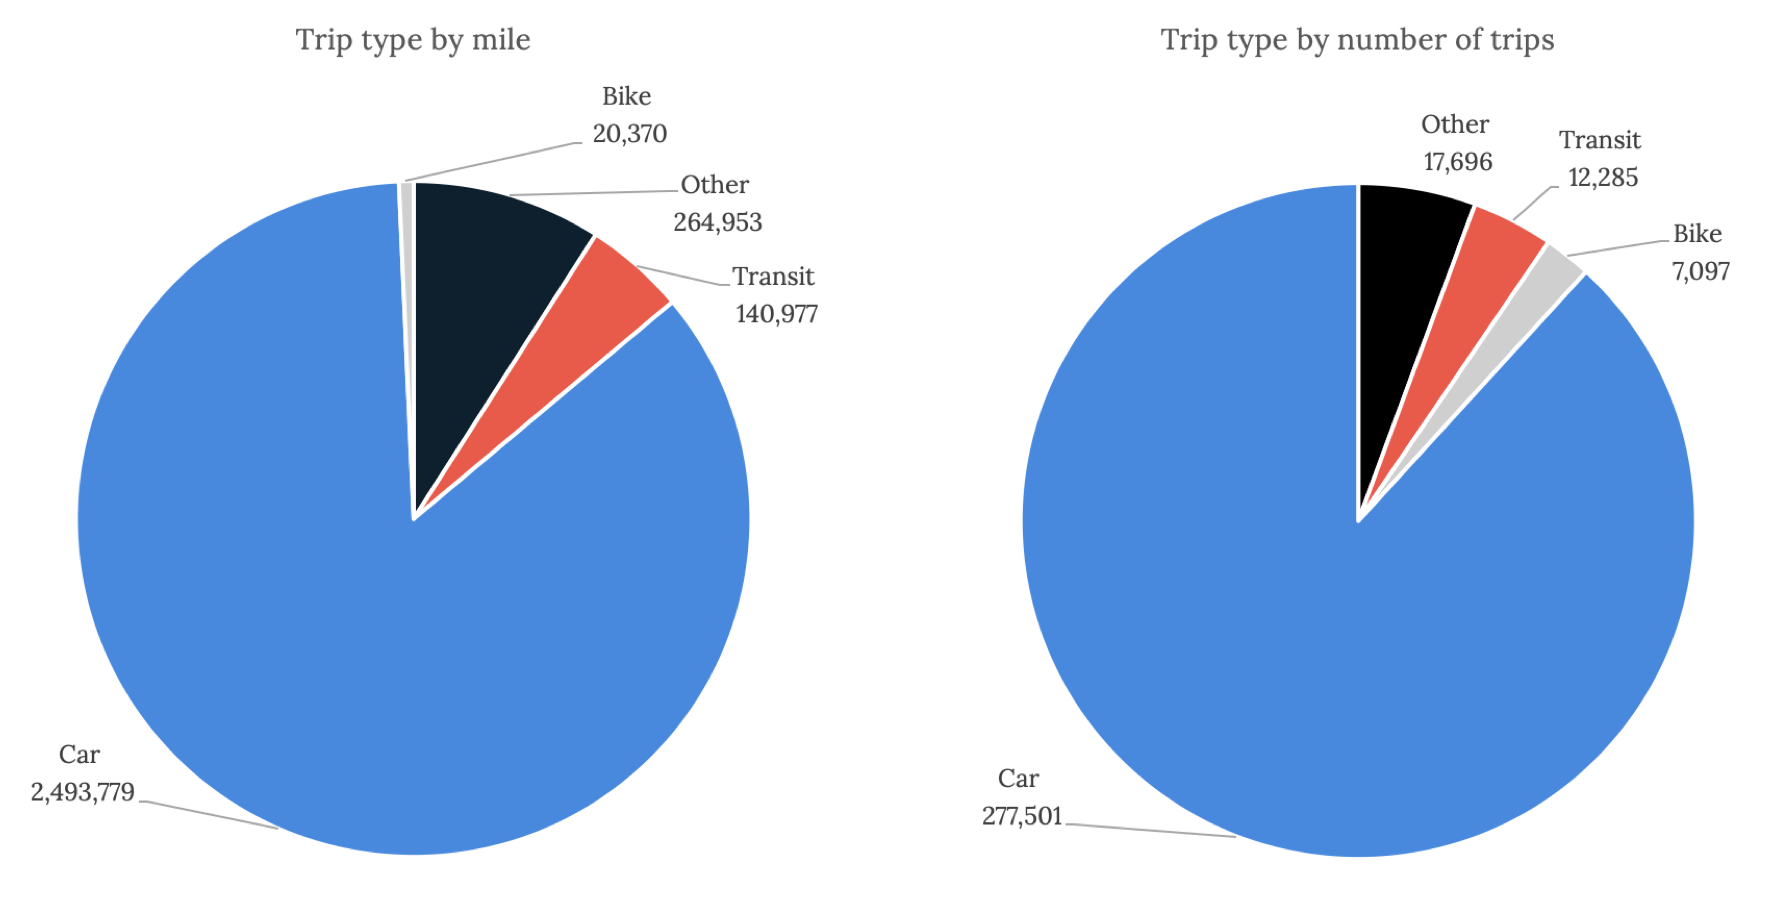
The app recorded a total of 2,920,079 miles over 314,579 trips. The pie charts breakdown the trips into four categories:
- car (excluding passenger trips)
- bike
- transit (including bus and train), and
- other (including airplane, boat, walking, passenger trips).
Unsurprisingly, the app recorded the greatest number of car trips, followed by other types of trips, transit trips, and finally bike trips.
Assessment report
The City learned a great deal from the competition, both about how an app can change driver behavior and about how Bostonian’s interact with the City’s roads.
This contest was largely about the user being able to reflect on their own driving habits. The aggregated and anonymized data was provided to the City to provide insight on how users performed over time on each of the metrics. In addition, the City of Boston and surrounding areas could be improved with better data. Data aggregated over the duration of the competition showing problem areas could be useful to City of Boston urban planners and engineers.
In this report, we outline the contest structure and present our findings from the data analysis.
2016 competition
In 2016, we piloted the competition to great outcomes. In the top 25 percent of users:

